
One of the primary concerns about urban sprawl has been that it is replacing our nation’s forests, wetlands, and prime farmland with subdivisions, new and expanded roads, strip malls, and business parks.
As the NRCS put it in the 2007 NRI summary report, reviewing the 1982-2007 quarter-century:
The net change of rural land into developed land has averaged 1.6 million acres per year over the last 25 years, resulting in reduced agricultural land, rangeland, and forest land. Loss of prime farmland, which may consist of agriculture land or forest land, is of particular concern due to its potential effect on crop production and wildlife.
Nationwide, from 1982 to 2017, about 69,000 square miles (44,175,300 acres) – an area larger than Florida – of previously undeveloped, non-federal rural land was paved over to accommodate our growing cities and towns. The total amount of developed land was 72.1 million acres in 1982. By 2017, this had risen to 116.3 million acres.
More than one-third (38 percent) of all land developed in our nation’s entire history has been developed in just the last 35 years. If this rate (1.26 million acres developed/year) had persisted for the entire 245-year history of the United States (since 1776), the total area of developed land in the country would be 309 million acres rather than 116 million acres, over two-and-a-half times as much.
Another way of stating this is that the annual rate of land development in the U.S. in recent decades is 2.66 times greater than the average rate throughout our history as a country.
The aggregate area of developed land in 2017 was about equal in size to the 10 states of Maine, New Hampshire, Vermont, Massachusetts, Connecticut, Rhode Island, Delaware, New Jersey, New York, and Pennsylvania combined, that is, all of New England and much of the Mid-Atlantic States.
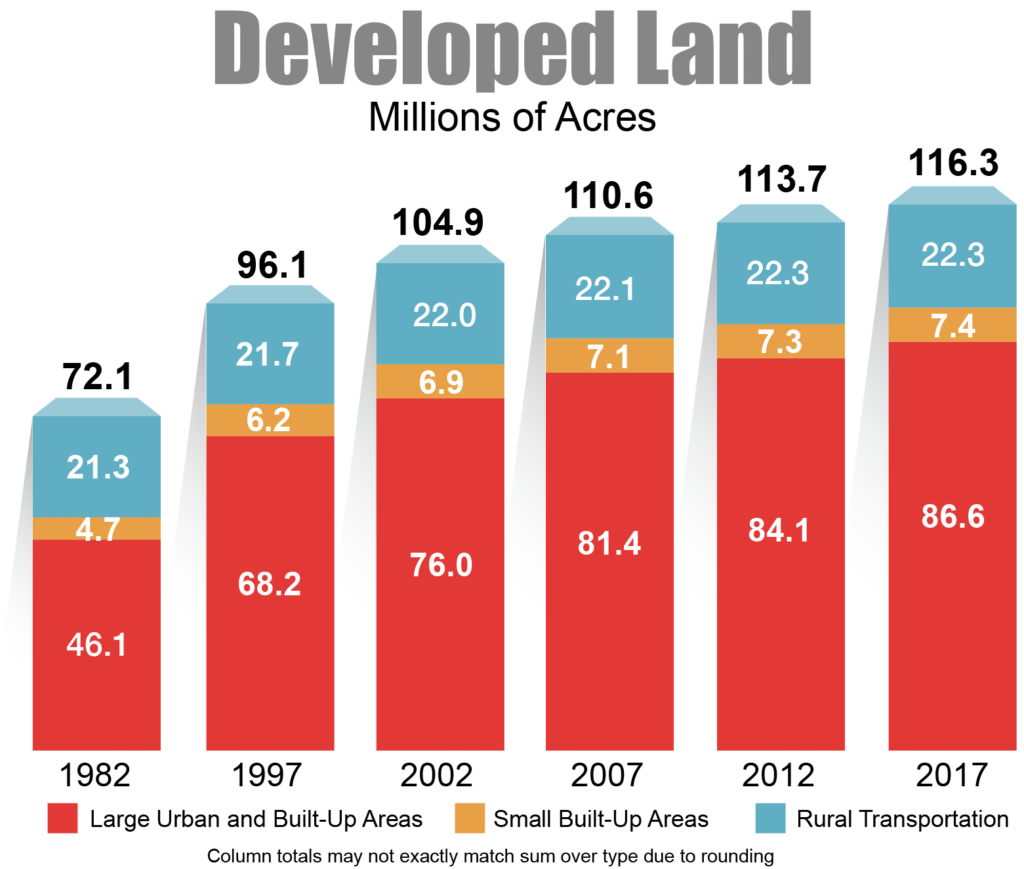
Cumulative Growth in Area of Developed Land Nationwide, 1982-2017
Source: 2017 National Resources Inventory, Summary Report, p. 2-6.
Where did these developed lands come from? What types of rural land uses were converted into developed land?
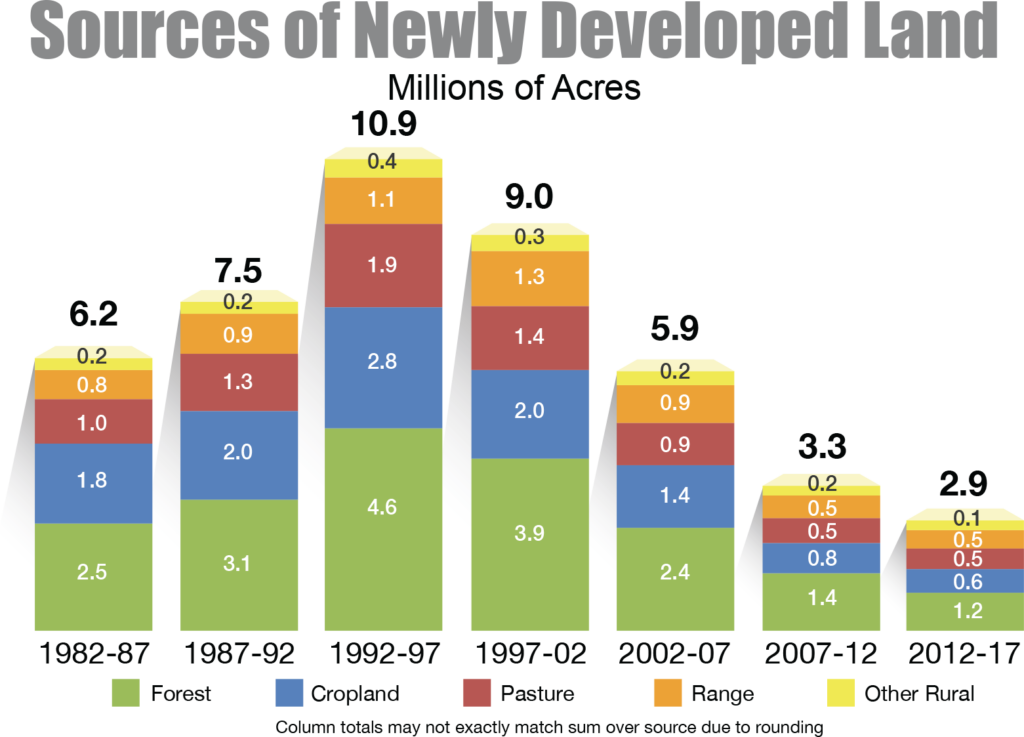
Sources of Newly Developed Land, 1982 to 2017
Source: 2017 National Resources Inventory, Summary Report, p. 2-7.
Of these 44 million acres lost – or “converted” as land managers and planners generally refer to it – approximately 11.1 million acres were cropland, 13.1 million acres were pasture and rangeland, and 18.8 million acres were forestland. “Other Rural” comprised 0.15 acre.
However, “as the population has increased, the acres developed per person has [sic] dropped off.” The five-year period from 1992 to 1997 witnessed the greatest loss of open space because of development, at 10.9 million acres. A decade later, from 2002 to 2007, this figure had dropped by almost half to 5.9 million acres.
The U.S. population grew by nearly 90 million during this period, at a rate of about 27 million new residents per decade, a very rapid (and unsustainable) rate of increase that adds nearly a new Texas (our second-most populous state after California) to the U.S. population every decade.
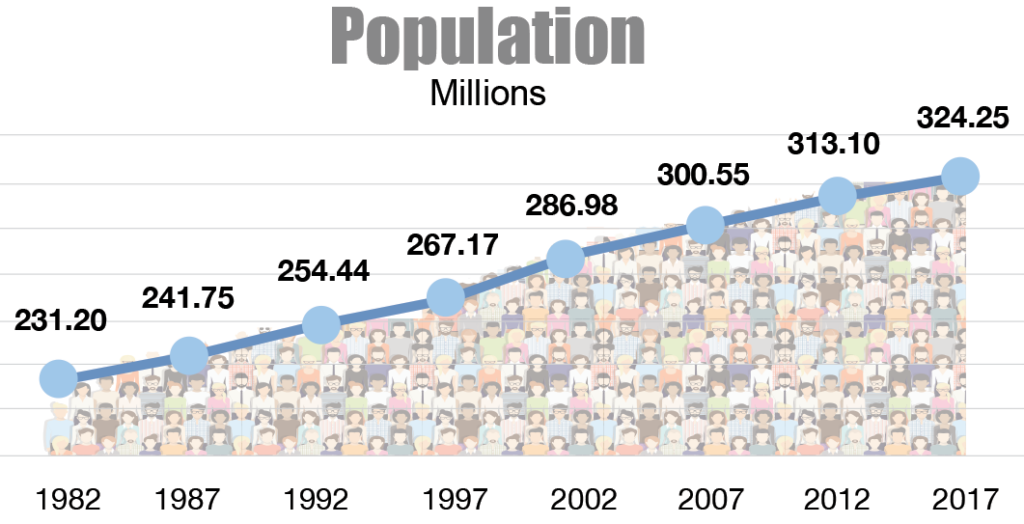
U.S. Population Growth from 1982 to 2015
Source: 2017 National Resources Inventory, Summary Report, p. 2-7
On average, on each of the 12,785 days in the 35 years between 1982 and 2017, approximately 3,455 acres (5.4 square miles) of open space in the United States succumbed to the bulldozer’s blade, asphalt, concrete, and buildings.
It is noteworthy that the amount of rural land converted to developed land rose and fell significantly during the 35-year time period. It went from 3,301 acres per day in the mid-1980s to a peak of 5,858 acres per day in the mid-1990s, and back down to 1,439 acres per day by 2012 to 2017, a reflection of increasing residential population density and also a response to the Great Recession of 2008 and its aftermath.
| Cumulative Increase in Developed Land in the United States, 1982-2017 | ||||
|---|---|---|---|---|
| Year | Area of Developed Land (thousand acres) | Period | Added annual increment of Developed Land during period (acres) | Average daily amount of land consumed by sprawl during period (acres) |
| 1982 | 72,127.7 | |||
| 1987 | 78,152.7 | 1982-1987 | 1,205,000 | 3,301 |
| 1992 | 85,399.2 | 1987-1992 | 1,449,300 | 3,971 |
| 1997 | 96,090.4 | 1992-1997 | 2,138,240 | 5,858 |
| 2002 | 104,880.8 | 1997-2002 | 1,758,080 | 4,817 |
| 2007 | 110,606.1 | 2002-2007 | 1,145,060 | 3,137 |
| 2012 | 113,676.2 | 2007-2012 | 614,020 | 1,682 |
| 2017 | 116,303.0 | 2012-2017 | 525,360 | 1,439 |
| Average | 1982-2017 | 1,262,151 | 3,455 | |
Source: Calculated from NRCS, 2020. Summary Report: 2017 National Resources Inventory, Table 1.
The area of cropland in the United States decreased from 420.3 million acres in 1982 to 367.5 million acres in 2017, a reduction of 13 percent.
Some of this former cropland (16 million acres in 2017) was temporarily protected under the federal Conservation Reserve Program (CRP) – administered by USDA’s Farm Service Agency (FSA) – the acreage of which rose from 14 million acres in 1987 to 33 million acres in 1997 before falling back down to 16 million acres in 2017.
However, CRP lands are considered more “environmentally sensitive” or ecologically marginal lands, often on steeper slopes more vulnerable to erosion, or more generally vulnerable to degradation from plowing, tilling, planting, harvesting, irrigation, fertilization, and other modern industrial farming practices.
Other former croplands were retired from cultivation and converted to pastureland, rangeland, and other rural land categories. However, some cropland was also developed: 11.1 million acres from 1982 to 2017, according to the NRI.
“Asphalt is the land’s last crop,” remarked former U.S. Assistant Secretary of Agriculture and conservationist Rupert Cutler back in the 1970s. Once a tract of farmland with its soils and the micro and macro-ecosystems they support are paved over, the probability of that patch of the Earth being restored within the foreseeable future to a functioning ecological habitat or productive agricultural land is miniscule.
America’s Bountiful Cropland: Productive Wheatfield under the Big Skies of the Great Plains
The area of U.S. pastureland declined from 131.2 million acres in 1982 to 121.6 million acres in 2017, a decrease of seven percent. The much larger area of non-federal (state and private) rangeland declined slightly over these 35 years, from 418.6 million acres to 403.9 million acres, a decrease of four percent. However, the NRI does not indicate whether the quality of that rangeland may have changed, either positively from implementation of conservation measures, or negatively from agents such as erosion or invasive species like the inedible creosote bush (Larrea tridentata), the spread of which in arid Southwestern rangeland has been facilitated by overgrazing of livestock.
Beef Cattle Grazing on Pastureland in Wisconsin
Stand of Creosote Bush on rangeland – while a native species, it is inedible by livestock and is considered invasive because it is an aggressive competitor
While the NRCS estimates that rates of erosion on the nation’s cropland decreased by 35 percent on average between 1982 and 2017, staggering amounts of topsoil are still being lost in spite of improved awareness and soil conservation measures. Every year, more than four and a half tons per acre are washed or blown away from the nation’s cultivated and non-cultivated croplands. This totaled 1.7 billion tons in aggregate at the national scale in 2017. Sheet and rill erosion from water accounted for 58 percent of this, while wind erosion was responsible for the other 42 percent.
Most soil scientists concur that it takes at least 100 years for natural processes to form just one inch of soil; the specific rate of soil formation depends on climate, vegetation, slope gradient, and other factors. Overall, scientists estimate that we are losing soils some 10 to 40 times faster than the rate of soil formation or renewal. Obviously, this is unsustainable.
The adverse effects of encroaching development extend beyond the zone of impervious surfaces, pavement, and rooftops and penetrate into nearby natural habitats. The fact is that development disturbs adjacent natural habitat even without destroying or altering it directly with bulldozers and construction. Development can cause habitat fragmentation, that is, breaking up large, intact areas of natural habitat into smaller strips, shreds, and fragments.
In such cases, these smaller, disparate, disconnected habitat bits and pieces may be too small to support viable populations of various wild flora and fauna, which are prevented from interacting and breeding due to development barriers like buildings, walls, fences, and streets. Genetic diversity is lost and the risk of inbreeding and reduced survival fitness grows. Housing-induced habitat fragmentation aids the introduction of exotic or invasive species. Due to “edge effects”, “patch-size effects,” and “isolation effects,” fragmentation is accompanied by biodiversity impoverishment and species loss, of both wild plants and wild animals.
It is estimated that about one-third of new houses in the United States are now constructed in previously undisturbed natural habitats. Roads connecting newly built residential subdivisions and commercial development break up the landscape and create hazards and barriers through wildlife home ranges. As any motorist knows from observing the carnage of roadkill, paved roads and streets are deathtraps for hapless vertebrates: mammals, reptiles, amphibians, and even some birds. An estimated one million animals are killed on American roads every day. Roadkill is now the leading cause of vertebrate mortality in the United States.
Roadkill is the leading cause of vertebrate mortality in the United States
Anthropogenic noise from cars, trucks, and motorcycles, railroads, airport takeoffs and landings, compressors, factories, oil and gas exploration and development, and even amplified music from loudspeakers encroaches deeply into natural habitats and adversely affects wildlife through behavioral disruption, acoustic masking, and increased stress response.
One recent study found that human noise doubled background sound levels in a majority of our nation’s protected natural areas, caused a 10-fold or greater increase in noise in 21 percent of these areas (surpassing noise levels known to interfere with human visitor experience), and significantly impaired habitats of endangered species.
In a 2010 paper in the Proceedings of the National Academy of Sciences entitled, “Housing growth in and near United States protected areas limits their conservation value,” the authors noted that protected areas are: “crucial for biodiversity conservation because they provide safe havens for species threatened by land-use change and resulting habitat loss.” However, the effectiveness of protected areas in the United States is threatened by rural sprawl and housing development in particular. The study’s findings show that housing development in close proximity may severely limit the ability of protected areas to serve as a modern “Noah’s Ark.” The authors found that between 1940 and 2000, 28 million housing units were built within 50 km of protected areas in the United States, and 940,000 homes were even constructed on private inholdings within national forest boundaries.
Further, they found that in the 1990s, housing built within 1 km of protected areas grew at a decadal rate of 20 percent, outpacing the national average of 13 percent. If these trends continue over the long term, another one million housing units would be built within 1 km of protected areas by 2030 (and 17 million housing units within 50 km), greatly reducing their value for wildlife and biodiversity conservation. The habitats protected as national parks, national wildlife refuges, national wilderness areas, and national forests are increasingly isolated spatially in an increasingly fragmented national landscape. In sum, protected areas in America, “are thus threatened similarly to those in developing countries. However, housing growth poses the main threat to protected areas in the United States whereas deforestation is the main threat in developing countries.”
Urban expansion, of course, is not merely an American or a North American phenomenon; it is a global one. And globally, urban expansion is also driven by population growth, among other factors, but unsurprisingly, population’s role in driving expansion and sprawl varies from continent to continent, region to region, and country to country. For example, population growth contributes to urban expansion more in North America than in Europe, which has very low rates of population growth compared to Canada and the United States.
Likewise, urban population growth is more closely related to urban expansion in Africa and India (both of which still experience rapid to very rapid population growth), than in China, where population growth is slowing and GDP growth is a greater factor in urban expansion.
Across the world, scholars and planners widely regard population growth as one of the most important factors driving “land take” and urban land expansion, along with income growth (higher GDP per capita), increased transport accessibility, weak or inadequate planning, and subsidies encouraging land consumption and automobile use.
Recognition by scholars that population growth is a major (not the only) driver of urban land expansion and sprawl is sharply at odds with the way the news media and anti-sprawl activists in the United States have tended to portray the causes of sprawl. The news media and anti-sprawl activists treat rapid, unending U.S. population growth on the order of 25 to 30 or more million new residents per decade as a given and a fait accompli. They rarely, if ever, question or challenge it.
Thus, since they want to convince Americans that something can still be done to halt or slow sprawl substantially in spite of never-ending U.S. population growth, they tend to downplay or minimize population’s importance as a causal factor in sprawl. In their efforts to publicize sprawl to the American public and enlist support for anti-sprawl measures – e.g., “smart growth” policies, higher residential densities, multifamily housing (apartments and condominiums), mixed land uses and zoning, and infill that eliminates existing urban open space (such as golf courses) – they reserve their criticism for “low-density sprawl,” essentially giving a pass to other new development on the urban periphery, as long as it is not low-density, even though it still permanently devours rural land and open space.