
This study focuses on the loss of previously undeveloped, or rural, land that includes cropland, pastureland, rangeland, forest, and other natural habitat and open space in the state of Colorado.
Using the National Resources Inventory (NRI) data for Developed Land, along with county by county Census Bureau population estimates for 1982, 2002, and 2017, we were able to measure the increase in the overall amount (area) of developed land in each Colorado county, and with those two datasets, estimate what fraction or percentage of that sprawl could be attributed to population growth and what portion was a result of an increase in per capita land use. Similarly, we used the U.S. Census Bureau Urbanized Land Area population and land area data for 2000 and 2010 to perform the same analysis for Colorado’s largest cities.
At its most basic level, there are three possible reasons for an increase in the area of developed or urbanized land: 1) each individual, on average, is consuming more developed land; 2) there are more people consuming the land; or 3) a combination of both factors is working together to create sprawl. This study attempts to quantify the relative roles of the two fundamental factors behind sprawl: rising per capita land consumption (that is, declining population density) and population growth.
Recall that the Census Bureau’s Urbanized Areas and the Natural Resources Conservation Service’s Developed Areas in the National Resources Inventory (NRI) are measured in two totally different manners, with different methodologies for collecting data on urban areas versus rural areas, and two completely distinct ways of defining the two land uses. Thus, quantifying sprawl using these two very different databases would not be expected to generate identical results, and indeed, our calculations do not. However, they produce fairly consistent results, which is a sign of the robustness of our findings and an indication of their probable veracity.
To better understand and quantify the respective roles of population growth and per capita land consumption in generating Overall Sprawl, we can use a more mathematically sophisticated method that is sometimes used to apportion consumption of natural resources between two or more factors. Physicist John Holdren, Ph.D., former Director of the White House Office of Science and Technology Policy and former president of the American Association for the Advancement of Science (AAAS), developed and applied this methodology in a scientific paper evaluating how much of the increase in energy consumption in the United States in recent decades was due to population growth, and how much to increasing per capita energy consumption. This rigorous method can be applied to virtually any type of resource the use of which is increasing over time, and the number of resource consumers is changing, the amount of the resource being used by each consumer on average is changing, or both.
Prior to being Director of the White House Office of Science and Technology Policy in the Obama Administration between 2009 and 2017, Holdren was Teresa and John Heinz Professor of Environmental Policy and Director of the Program on Science, Technology, and Public Policy at Harvard University’s Kennedy School of Government, as well as Professor of Environmental Science and Public
Policy in the Department of Earth and Planetary Sciences at that university. Trained in aeronautics/ astronautics and plasma physics at MIT and Stanford, he co-founded and for 23 years co-led the campus-wide interdisciplinary graduate degree program in energy and resources at the University of California, Berkeley. On April 12, 2000 he was awarded the Tyler Prize for Environmental Achievement at the University of Southern California, which administers the award. The Tyler Prize is the premier international award honoring achievements in environmental science, energy, and medical discoveries.
This study, as have our other studies over the past two decades, applies this method to sprawl. Rural, undeveloped land (both natural habitat and farmland) is thus the resource in question. As in the case of looking at energy consumption, the issue here is how much of the increased total consumption of rural land (Overall Sprawl) is related to the increase in per capita land consumption (Per Capita Sprawl) and how much is related to the increase in the number of land consumers (Population Growth). Using this technique we are able to obtain a “first order approximation” of the percentage of sprawl related to a growing population and the percentage related to growing per capita land consumption.
1. "Population" refers to increase in population.
2. "Consumption" refers to increase in developed land consumption per capita (per person).
Watch video for further explanation
| Sources of Sprawl in Colorado Counties, 1982-2017 | |||
|---|---|---|---|
| County | Total Sprawl 1982 to 2017 (square miles) | % of Total Sprawl Related to POPULATION GROWTH | % of Total Sprawl Related to GROWTH IN PER CAPITA LAND CONSUMPTION | Adams | 80.3 | 86 | 14 |
| Adams | 80.3 | 86 | 14 |
| Alamosa | 11.3 | 37 | 63 |
| Arapahoe | 67.5 | 100 | 0 |
| Archuleta | 26.9 | 99 | 1 |
| Baca | 0.5 | 0 | 100 |
| Bent | 1.6 | 0 | 100 |
| Boulder* | 52.8 | 100 0 | |
| Chaffee | 5.5 | 100 | 0 |
| Cheyenne | 1.9 | 0 | 100 |
| Clear Creek | 5.9 | 29 | 71 |
| Conejos | 2.3 | 35 | 65 |
| Costilla | 5.3 | 72 | 28 |
| Crowley | 0.6 | 100 | 0 |
| Custer | 21.1 | 100 | 0 |
| Delta | 9.2 | 28 | 72 |
| Denver | 29.2 | 100 | 0 |
| Dolores | 0.9 | 91 | 9 |
| Douglas | 131.4 | 100 | 0 |
| Eagle | 27.5 | 100 | 0 |
| Elbert | 7.3 | 100 | 0 |
| El Paso | 175.0 | 100 | 0 |
| Fremont | 21.9 | 70 | 30 |
| Garfield | 31.3 | 100 | 0 |
| Gilpin | 2.8 | 100 | 0 |
| Grand | 15.3 | 100 | 0 |
| Gunnison | 4.2 | 100 | 0 |
| Hinsdale | 1.4 | 71 | 29 |
| Huerfano | 4.7 | 0 | 100 |
| Jackson | 0.8 | 0 | 100 |
| Jefferson | 95.8 | 82 | 18 |
| Kiowa | 0.8 | 0 | 100 |
| Kit Carson | 1.7 | 0 | 100 |
| Lake | 2.7 | 0 | 100 |
| La Plata | 37.8 | 65 | 35 |
| Larimer | 67.0 | 100 | 0 |
| Las Animas | 6.6 | 0 | 100 |
| Lincoln | 2.5 | 100 | 0 |
| Logan | 0.9 | 100 | 0 |
| Mesa | 23.9 | 87 | 13 |
| Mineral | 2.3 | 0 | 100 |
| Moffat | 3.4 | 0 | 100 |
| Montezuma | 16.1 | 47 | 53 |
| Montrose | 14.5 | 58 | 42 |
| Morgan | 6.6 | 92 | 8 |
| Otero | 3.6 | 0 | 100 |
| Ouray | 5.2 | 100 | 0 |
| Park | 28.8 | 100 | 0 |
| Phillips | 0.8 | 0 | 100 |
| Pitkin | 12.3 | 100 | 0 |
| Prowers | 0.9 | 0 | 100 |
| Pueblo | 45.3 | 24 | 76 |
| Rio Blanco | 2.7 | 0 | 100 |
| Rio Grande | 2.8 | 19 | 81 |
| Routt | 3.8 | 100 | 0 |
| Saguache | 3.4 | 100 | 0 |
| San Juan | 1.1 | 0 | 100 |
| San Miguel | 6.9 | 100 | 0 |
| Sedgwick | 3.1 | 0 | 100 |
| Summit | 12.0 | 100 | 0 |
| Teller | 18.0 | 100 | 0 |
| Washington | 1.1 | 0 | 100 |
| Weld | 22.8 | 100 | 0 |
| Yuma | 2.8 | 26 | 74 |
| TOTAL SPRAWL | 1,206.4 | 100 | 0 |
| WEIGHTED AVERAGE** | 1,206.4 | 86 | 14 |
1. "Population" refers to increase in population.
2. "Consumption" refers to increase in developed land consumption per capita (per person).
Watch video for further explanation
| Sources of Recent Sprawl in Colorado Counties, 2002-2017 | |||
|---|---|---|---|
| County | Total Sprawl 2002 to 2017 (square miles) | % of Total Sprawl Related to POPULATION GROWTH | % of Total Sprawl Related to GROWTH IN PER CAPITA LAND CONSUMPTION |
| Adams | 33.3 | 100 | 0 |
| Alamosa | 6.3 | 19 | 81 |
| Arapahoe | 11.3 | 100 | 0 |
| Archuleta | 4.5 | 100 | 0 |
| Baca | 0.0 | 0 | 100 |
| Bent | 0.8 | 0 | 100 |
| Boulder* | 10.5 | 100 | 0 |
| Chaffee | 1.1 | 100 | 0 |
| Cheyenne | 0.0 | 0 | 100 |
| Clear Creek | 0.5 | 14 | 86 |
| Conejos | 1.3 | 0 | 100 |
| Costilla | 1.1 | 68 | 32 |
| Crowley | 0.6 | 48 | 52 |
| Custer | 5.3 | 100 | 0 |
| Delta | 3.3 | 26 | 74 |
| Denver | 6.3 | 100 | 0 |
| Dolores | 0.2 | 100 | 0 |
| Douglas | 50.0 | 100 | 0 |
| Eagle | 5.8 | 100 | 0 |
| Elbert | 1.7 | 100 | 0 |
| El Paso | 25.5 | 100 | 0 |
| Fremont | 9.2 | 5 | 95 |
| Garfield | 11.7 | 100 | 0 |
| Gilpin | 0.5 | 100 | 0 |
| Grand | 5.3 | 100 | 0 |
| Gunnison | 0.8 | 100 | 0 |
| Hinsdale | 0.2 | 0 | 100 |
| Huerfano | 0.6 | 0 | 100 |
| Jackson | -0.3 | 0 | 100 |
| Jefferson | 14.7 | 100 | 0 |
| Kiowa | 0.0 | 0 | 100 |
| Kit Carson | 0.5 | 0 | 100 |
| Lake | 0.5 | 14 | 86 |
| La Plata | 9.4 | 100 | 0 |
| Larimer | 25.2 | 100 | 0 |
| Las Animas | 4.5 | 0 | 100 |
| Lincoln | -0.6 | 0 | 100 |
| Logan | -0.5 | 0 | 100 |
| Mesa | 5.9 | 100 | 0 |
| Mineral | 0.9 | 0 | 100 |
| Moffat | 2.0 | 0 | 100 |
| Montezuma | 5.6 | 41 | 59 |
| Montrose | 3.6 | 100 | 0 |
| Morgan | 0.0 | 0 | 100 |
| Otero | 0.5 | 0 | 100 |
| Ouray | 1.7 | 100 | 0 |
| Park | 14.2 | 42 | 58 |
| Phillips | 0.3 | 0 | 100 |
| Pitkin | 1.3 | 100 | 0 |
| Prowers | -0.8 | 0 | 100 |
| Pueblo | 1.9 | 100 | 0 |
| Rio Blanco | 1.4 | 49 | 51 |
| Rio Grande | 0.5 | 0 | 100 |
| Routt | 1.4 | 100 | 0 |
| Saguache | 1.1 | 73 | 27 |
| San Juan | 0.0 | 0 | 100 |
| San Miguel | 0.9 | 100 | 0 |
| Sedgwick | 0.6 | 0 | 100 |
| Summit | 3.3 | 100 | 0 |
| Teller | 5.0 | 76 | 24 |
| Washington | 0.3 | 0 | 100 |
| Weld | 16.7 | 100 | 0 |
| Yuma | 1.7 | 26 | 74 |
| TOTAL SPRAWL | 320.8 | 100 | 0 |
| WEIGHTED AVERAGE** | 320.8 | 86 | 14 |
* Broomfield County, the newest and smallest county by area in Colorado, was carved out of Boulder County in 2001; for the purposes of this study it is included with Boulder County.
**Each county’s contribution to aggregate total weighted by relative amount of its sprawl and % sprawl due to population constrained to between 0-100%.
These estimates indicate that population growth – an increase in the number of Colorado residents – accounted for 86 out of every 100 acres developed in Colorado in recent decades. To some, the predominant role of population growth may seem unsurprising, in that each person who resides in any given place is responsible for converting a given amount of rural land into a given amount of developed land to meet a number of physical needs: for residence, workplace, transportation, commerce, manufacture, utility infrastructure (e.g., water, energy, wastewater treatment), and so on.
For others, the reality that population growth is by far the main driver of sprawl may come as a surprise, because for the last two decades or more, environmental groups, anti-sprawl organizations, politicians, and the news media have typically been loath to call attention to population’s role in sprawl. When these entities do mention “population” and “sprawl” in the same sentence, it is usually only to dismiss or minimize population’s influence.
Colorado has three regions when it comes to sprawl: western (mountain), Front Range, and eastern plains. By far the most sprawl is concentrated along the Front Range of the Rockies, whereas both the eastern and western parts of the state experience relatively little sprawl.
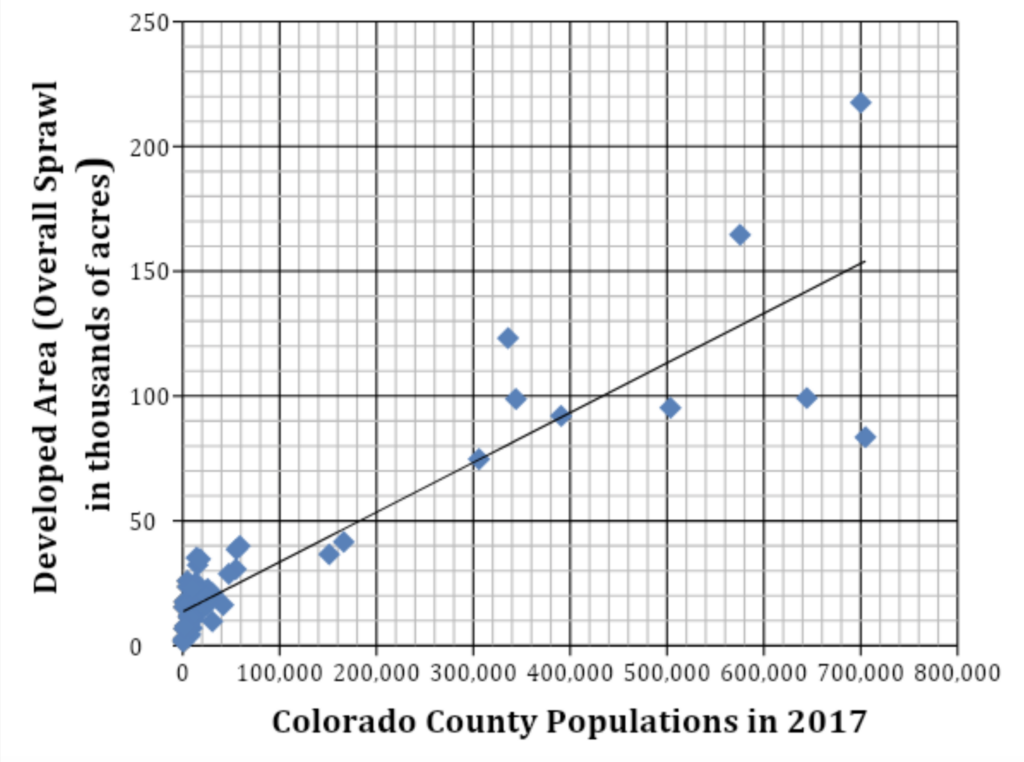
Another useful way to examine the relationships between the factors in sprawl is by using scatter plot analysis. The scatter plot below examines the relationship between each county’s population in 2017 on the x-axis (horizontal axis) and the area of developed land (i.e., cumulative total sprawl) on the y-axis (vertical axis). The scatter plot has a “best fit” line that shows the linear relationship between population and total sprawl.
Many respected environmental organizations and urban planners contend that implementing Smart Growth, New Urbanism, and LEED (Leadership in Energy & Environmental Design) building strategies into our new and existing cities is the best way to rein in sprawl in our cities. However, this is based on the premise that it is only or primarily our land-use choices that cause sprawl in Colorado. As our multiple studies over the past two decades demonstrate conclusively, Per Capita Sprawl by itself could not explain Overall Sprawl in the great majority of America’s urbanized or developed areas.
Colorado is no exception.
By comparing the percentage growth of per capita land consumption (Per Capita Sprawl) with the percentage growth of Overall Sprawl in the nine Urbanized Areas in Colorado from 2000 to 2010 (2020 data is not yet available), we find that the Per Capita Sprawl percentage is much smaller than the Overall Sprawl percentage: 4 percent versus 25 percent. This is not to denigrate Smart Growth, New Urbanism, and the LEED program, but to recognize their limitations when they don’t also focus on the role of population growth. These multi-faceted, multi-jurisdictional approaches have indeed slowed the pace at which sprawl is converting the countryside into pavement and buildings over the last decade. Given incessant population growth, however, they are capable only of slowing sprawl, not stopping it.
Note: Per Capita Sprawl is % growth in per capita urbanized land consumption and Overall Sprawl is % growth in urbanized land area.
| Colorado Urbanized Areas – 2000 to 2010 | |||
|---|---|---|---|
| Urbanized Area | % Change in Per Capita Land Consumption, 2000-2010(PER CAPITA SPRAWL) | % Change in Overall Land Consumption, 2000-2010(OVERALL SPRAWL) | |
| Denver--Aurora, CO | 12% | 34% | |
| Colorado Springs, CO | -21% | -5%* | |
| Fort Collins, CO | 2% | 31% | |
| Pueblo, CO | 25% | 38% | |
| Grand Junction, CO | 1% | 41% | |
| Greeley, CO | -3% | 22% | |
| Boulder, CO | -3% | -1%* | |
| Longmont, CO | -7% | 16% | |
| Lafayette--Louisville--Erie, CO | -4% | 26% | |
| All Colorado UAs | 4% | 25% | |
Even the best Smart Growth, New Urbanism, and LEED strategies are able to engineer only so much population density. As long as the population is still growing, the land area taken up by Colorado cities will almost certainly continue to grow.
This table compares the percentages of Per Capita Sprawl and Overall Sprawl from 2000 to 2010 in all nine UAs in the state of Colorado. In all cases but two (anomalies), Per Capita Sprawl is only a small fraction of Overall Sprawl. Per Capita Sprawl was non-existent (negative) in the smaller four of the nine UAs, but positive in the two largest UAs – Phoenix-Mesa and Tucson, though still much smaller than Overall Sprawl.
A city or state’s population increases or decreases based on the net sum of the collective actions of millions of individuals and their personal choices and behaviors – births, deaths, and in- or out-migration (emigration) – as well as on local, state, and national governmental actions and policies. Looking more closely, the net increase (or decrease) in population in any given time period (e.g., one year, one decade) is due to the number of births minus the number of deaths plus the number of in-migrants (immigrants) minus the number of out-migrants (emigrants).
In 1910, there were just over one-half million (543,000) residents in Colorado; after 120 years of nearly continuous growth, this number had exploded by more than 10-fold (i.e., more than an “order of magnitude” increase) to approximately 5.8 million. The fact that this function is generally curving upward suggests exponential growth for much of the period of record. Overall, the average annual compound or exponential rate of increase over this 120-year period (1900-2020) was about two percent (1.98954% to be precise).
Colorado is a prime example of what a seemingly modest annual growth rate can lead to if just given enough time. A mere two percent per annum growth rate steadily maintained for 35 years leads inexorably to an approximate doubling in the population size or number of any entity – whether dollars, wombats, widgets, or human beings. These remarkable facts and many others related to the exponential function were the subject of more than 1,600 presentations on “Arithmetic, Population, and Energy: Sustainability 101 given to audiences numbering collectively in the hundreds of thousands over nearly 50 years by the late University of Colorado-Boulder physics professor Albert Bartlett.
* Broomfield County, the newest and smallest county by area in Colorado, was carved out of Boulder County in 2001; for the purposes of this study its population and small area are included with Boulder County
This map shows the population change in all Colorado counties from 1982 to 2017. On average during those 35 years, these 64 counties (including Broomfield, lumped in with Boulder) grew by 83 percent; that was an annual compound (exponential) rate of 1.75 percent. The populations of 46 of Colorado’s 64 counties increased, while 17 decreased, and one (Bent County) underwent essentially no change (just 12 fewer residents in 2017 than in 1982).
The map covers a period that starts in 1982 when the first federal NRI results were published, and ends in 2017, the year of the last available data at the time of this report.
Unsurprisingly, the greatest population growth occurred in counties along the Front Range of the Rockies: El Paso, Arapahoe, Douglas, Adams, Denver, Boulder, Larimer, and Weld.
* Broomfield County, the newest and smallest county by area in Colorado, was carved out of Boulder County in 2001; for the purposes of this study its population and small area are included with Boulder County
This map shows the more recent sub-period from 2002 to 2017. The aggregate population of Colorado’s 64 counties increased by 25 percent during these 15 years, at an annual compound (exponential) rate of 1.5 percent, almost identical to (but slightly slower than) the percent (1.6) during the larger 35-year period from 1982 to 2017.
The populations of 45 counties increased while 19 decreased. While the rate of annual percentage increase (1.5%) in this most recent period was a bit lower than the average annual percentage increase over the entire 35-year period of record (1.6%) for NRI developed land in Colorado, the difference in the annual increment (average number of people added yearly to Colorado’s population) was the opposite. A few more residents were added annually between 2002 and 2017 (74,765) than were added annually per year between 1982 and 2017 (72,866).
In the 2000 and 2010 censuses, Colorado had nine delineated Urbanized Areas (the data for the 2020 census has not been released). These cities grew in aggregate by 20 percent in the single decade from 2000 to 2010.
| Population Growth in Colorado Urbanized Areas – 2000 to 2010 | ||||
|---|---|---|---|---|
| Urbanized Area | Population in 2000 | Population in 2010 | Change, 2000-2010 | % increase (decrease) |
| Denver--Aurora, CO | 1,984,889 | 2,374,203 | 389,314 | 20% |
| Colorado Springs, CO | 466,122 | 559,409 | 93,287 | 20% |
| Fort Collins, CO | 206,757 | 264,465 | 57,708 | 28% |
| Pueblo, CO | 123,351 | 136,550 | 13,199 | 11% |
| Grand Junction, CO | 92,362 | 128,124 | 35,762 | 39% |
| Greeley, CO | 93,879 | 117,825 | 23,946 | 26% |
| Boulder, CO | 112,299 | 114,591 | 2,292 | 2% |
| Longmont, CO | 72,929 | 90,897 | 17,968 | 25% |
| Lafayette--Louisville--Erie, CO | 60,387 | 79,407 | 19,020 | 31% |
| All Colorado Urbanized Areas | 3,212,975 | 3,865,471 | 652,496 | 20% |
Nowadays, rapid growth in an urban area’s population is much more likely to be the result of enticing residents to relocate from elsewhere. Local and state governments can and do create many explicit incentives or subsidies that encourage people to move into a particular urban area. These include aggressive campaigns to persuade industries and corporations to move their factories, offices, headquarters, and jobs from another location, public subsidies for the infrastructure that supports businesses, tax breaks, expansion of water service and sewage lines into new areas, new housing developments and new residents, and general public relations that increase the attractiveness and “business friendliness” of a city to outsiders and the business community.
Even without trying, a city can attract new residents, especially if the nation’s population is growing significantly, as continues to be the case today. just by maintaining amenities, good schools, low crime rates, pleasant parks, and a high quality of life
Colorado’s population has doubled between the 1980 and 2020 Censuses with growth being particularly rapid between 1990 and 2010. The State Demography Office projected in 2021 that Colorado’s population would reach 7.6 million in 2050.
In one form of analysis, all of Colorado’s population growth from 1982 to 2017 can be measured in two sources:
This includes births to and deaths of both those born in the United States and those born in other countries.
A little more than half (53%) of Colorado’s population expansion was due to people moving into the state while significantly fewer moved out during that period. The in-migration counts people who moved to Colorado directly from abroad and people (both U.S.-born and foreign-born) who moved into Colorado from other states.
More recently, migration has become a much greater source of population growth in Colorado.
Like other western states who have seen rapid population growth, Colorado has taken in an influx of migrants from California, which has experienced many negative quality-of-life developments stemming from its own massive population growth in recent decades. However, Colorado has attracted residents from across the United States, many moving long distances to relocate in the Centennial State.
| Rank | State |
|---|---|
| 1. | California |
| 2. | Texas |
| 3. | Florida |
| 4. | Arizona |
| 5. | Illinois |
| 6. | New York |
| 7. | Virginia |
| 8. | North Carolina |
| 9. | Georgia |
| 10. | Missouri |
Another way to measure a state’s population growth is to divide all growth between these two sources:
1. "Population" refers to increase in population.
2. "Consumption" refers to increase in developed land consumption per capita (per person).
Watch video for further explanation
CAUSES OF THE POPULATION GROWTH: According to Census Bureau data, Colorado’s total population was 3,045,000 in 1982 and 5,617,421 in 2017, an increase of 2.6 million.* Net migration from 1982 to 2017 — people moving into the state from other states or other countries minus those leaving — was equal to 53% of the increase (1.4 million) Of that number, 34% percent (466,000) or about one-third were immigrants (legal and illegal) who moved into the United States over this time period and were living in Colorado by 2017. Births to U.S.-born Americans and immigrants minus deaths (natural increase) in the state were equal to the other 47% of population increase.**
* Figures come from the public use file of the 2017 American Community Survey (ACS). Immigrants or the foreign born are all those who are not U.S.-born at birth. Respondents to the ACS are asked what year they came to live in the United States.
** The Colorado Division of Local Affairs, Division of Local Government, State Demography Office has data that shows natural increase (births minus deaths) in Colorado and total net migration into the state. For natural increase and total net migration see State Births, Deaths, and Net Migration Spreadsheet, 1970-2025, “Colorado Population Growth: Components of Change, 1970-2025;” “Regional Components of Change for Colorado, 1970-2050;” “County Components of Change for Colorado, 1970-2050.”
International in-migration: Additional pressure to increase development in Colorado is caused by the federal government’s immigration policies that allows roughly 1.5 million new people per year to come legally and illegally from countries outside of the U.S. This causes massive, unrelenting U.S. population growth in some states that creates problems that pushes many residents to leave their states and move to places like Colorado. For example, in 2016 the top four states from which people moved to Colorado were California, Texas, Florida, and Arizona. Not coincidentally, those exact states have some of the highest rates of international migration. The arrival of immigrants into Colorado since 1982 and their U.S.-born progeny account for an estimated 26% of Colorado’s population growth over this time period.
The Census Bureau’s American Community Survey and Current Population Survey identifies immigrants and asks what year they came to the United States. We use the ACS to measure the number of immigrants living in Colorado in 2017 who entered the country in 1982 or later. In addition to the ACS, we use the Current Population Annual Social and Economic Supplement (ASEC CPS), which asks respondents the birthplace of their parents. We use this information to estimate the number of U.S.-born descendants of post-1982 immigrants in the state. It should be pointed out that all children born in the United States are automatically granted U.S. citizenship regardless of the immigration status of their parents. Also, in order to accurately measure the full effect immigration has on population growth, all demographers include the U.S.-born progeny of immigrants.
For examples, see U.S. Census Bureau, “A Changing Nation: Population Projections under Alternative Migration Scenarios,” Report Number P25-1146, February 2020; Pew Research Center, “Modern Immigration Wave Brings 59 Million to U.S., Driving Population Growth and Change Through 2065,”September 25, 2015; Center for Immigration Studies, “Projecting the Impact of Immigration on the U.S. Population,” February 4, 2019.
The 2017 ACS shows 466,000 immigrants living in Colorado who arrived in the country in 1982 or later. This number has been adjusted to exclude half of those who indicated in 2017 that they arrived in the year 1982. This is necessary because the ACS and the population estimate on which overall state population growth is based reflect the population on July 1 of each year. However, the ACS measures immigrant arrivals by calendar year. In addition to immigrants who arrived in 1982 we also find based on 2017 CPS ASEC that there were 125,000 U.S.-born children (under age 18) of post-1982 immigrants in the state. (We exclude those with only an immigrant father to avoid double counting.) As these children still live with their parents, estimating their number is straightforward.
To estimate the number of U.S.-born adults in 2017 with post-1982 immigrant parents, we use the 1999 CPS ASEC. In 1999 these individuals were still minors and lived with their immigrant parents. In 1999, 51 percent of second-generation children born 1982 to 1999 with a foreign-born mother were the child of a parent who came in 1982 or later. The remainder of U.S.-born second-generation Americans in this age group were born to immigrant parents who arrived prior to 1982. Applying this percentage to the adult children of immigrants 18 to 35 in 2017 means there were 60,000 U.S.-born adult offspring of post-1982 immigrants in Colorado, and 125,000 minor children of U.S.-born adult offspring of post-1982 immigrants in Colorado.
Finally, we find that there were 22,000 minor children with second generation parents who are 15 to 35 in 2017. These second-generation parents are old enough to have a child, but young enough to have been born to a post-1982 immigrant. We again assume that 51 percent of these second-generation parents are the offspring of a post-1982 immigrant giving us an estimated 11,000 U.S.-born grandchildren of post-1982 immigrants in Colorado in 2017.
Per capita land consumption statistics are a useful way to understand the combined power of numerous land use and consumption choices that can lead to urban sprawl.
When Census Bureau data show that per capita land consumption was 0.18 acre in 2010 in the Denver-Aurora Urbanized Area, it means that it takes a bit less than one-fifth of an acre to provide the average Denver-Aurora resident with space for housing, work, retail, transportation, education, religious assembly, government, recreation, utilities, and all other urban needs.
Looked at another way, the per capita land consumption of a city or a county is determined by dividing all the developed acreage by the total number of residents. The lower the per capita consumption number, the more efficiently the population is using the land for urban purposes.
At a minimum, the per capita land consumption figure reflects the combined outcome of all the following individual and institutional choices and factors:
The table below shows the change in per capita developed land use in Colorado’s 64 counties from 1982 to 2017. Overall, the state’s per capita land consumption decreased from 0.39 to 0.35 acre, meaning that, statewide, the average Colorado resident used less developed land in 2017 than in 1982, that is, average population density increased. However, in 38 of 64 counties, slightly more than half, per capita land consumption actually increased, meaning that density went down in those counties. In the other 26 counties, per capita developed land consumption decreased and density increased over this 35-year period.
| County | Per Capita Land Consumption – 1982 (acre) | Per Capita Land Consumption – 2017 (acre) | % Change in Per Capita Land Consumption, 1982-2017 |
|---|---|---|---|
| Adams | 0.17 | 0.19 | 12 |
| Alamosa | 0.55 | 0.87 | 58 |
| Arapahoe | 0.17 | 0.15 | -9 |
| Archuleta | 1.89 | 1.90 | 1 |
| Baca | 3.42 | 5.12 | 50 |
| Bent | 1.78 | 1.96 | 10 |
| Boulder* | 0.29 | 0.24 | -19 |
| Chaffee | 0.83 | 0.74 | -11 |
| Cheyenne | 7.15 | 9.44 | 32 |
| Clear Creek | 0.42 | 0.73 | 75 |
| Conejos | 1.06 | 1.18 | 12 |
| Costilla | 3.80 | 4.07 | 7 |
| Crowley | 2.03 | 1.11 | -45 |
| Custer | 7.61 | 5.33 | -30 |
| Delta | 0.16 | 0.32 | 96 |
| Denver | 0.13 | 0.12 | -8 |
| Dolores | 1.44 | 1.47 | 2 |
| Douglas | 1.31 | 0.37 | -72 |
| Eagle | 0.82 | 0.56 | -32 |
| Elbert | 2.42 | 0.88 | -64 |
| El Paso | 0.32 | 0.31 | -2 |
| Fremont | 0.49 | 0.60 | 23 |
| Garfield | 0.70 | 0.68 | -3 |
| Gilpin | 0.68 | 0.60 | -11 |
| Grand | 2.79 | 2.10 | -25 |
| Gunnison | 1.20 | 0.93 | -22 |
| Hinsdale | 1.59 | 2.02 | 27 |
| Huerfano | 1.40 | 1.86 | 33 |
| Jackson | 3.50 | 4.95 | 41 |
| Jefferson | 0.26 | 0.29 | 9 |
| Kiowa | 7.84 | 11.28 | 44 |
| Kit Carson | 2.20 | 2.49 | 13 |
| Lake | 0.33 | 0.58 | 76 |
| La Plata | 0.49 | 0.69 | 42 |
| Larimer | 0.36 | 0.29 | -19 |
| Las Animas | 2.05 | 2.48 | 21 |
| Lincoln | 3.39 | 3.08 | -9 |
| Logan | 0.84 | 0.78 | -8 |
| Mesa | 0.23 | 0.24 | 7 |
| Mineral | 1.30 | 3.45 | 166 |
| Moffat | 0.75 | 0.98 | 31 |
| Montezuma | 0.48 | 0.72 | 51 |
| Montrose | 0.27 | 0.39 | 42 |
| Morgan | 0.67 | 0.68 | 2 |
| Otero | 0.67 | 0.94 | 41 |
| Ouray | 1.76 | 1.45 | -17 |
| Park | 2.70 | 1.94 | -28 |
| Phillips | 1.62 | 1.87 | 15 |
| Pitkin | 1.24 | 1.17 | -5 |
| Prowers | 1.47 | 1.68 | 14 |
| Pueblo | 0.10 | 0.25 | 149 |
| Rio Blanco | 0.78 | 1.13 | 45 |
| Rio Grande | 0.82 | 0.95 | 16 |
| Routt | 0.99 | 0.65 | -35 |
| Saguache | 1.43 | 1.22 | -15 |
| San Juan | 1.38 | 2.81 | 104 |
| San Miguel | 2.35 | 1.43 | -39 |
| Sedgwick | 1.80 | 3.38 | 88 |
| Summit | 1.28 | 0.68 | -47 |
| Teller | 0.89 | 0.79 | -11 |
| Washington | 4.30 | 4.80 | 11 |
| Weld | 0.48 | 0.24 | -49 |
| Yuma | 2.18 | 2.32 | 6 |
| All Colorado Counties | 0.39 | 0.35 | -10 |
The table below shows the change in per capita developed land use in Colorado’s 64 counties from 2002 to 2017. Overall, the state’s per capita land consumption decreased from 0.39 to 0.35 acre, meaning that, statewide, the average Colorado resident used less developed land in 2017 than in 2002, that is, average population density increased. However, in 33 of 64 counties, slightly more than half, per capita land consumption actually increased, meaning that density went down in those counties. In the other 31 counties, per capita developed land consumption decreased (negative sign in the rightmost column below) and density increased over this 35-year period.
| County | Per Capita Land Consumption – 2002 (acre) | Per Capita Land Consumption – 2017 (acre) | % Change in Per Capita Land Consumption, 2002-2017 |
|---|---|---|---|
| Adams | 0.20 | 0.19 | -5 |
| Alamosa | 0.66 | 0.87 | 31 |
| Arapahoe | 0.18 | 0.15 | -15 |
| Archuleta | 2.06 | 1.90 | -8 |
| Baca | 4.20 | 5.12 | 22 |
| Bent | 1.82 | 1.96 | 7 |
| Boulder* | 0.27 | 0.24 | -11 |
| Chaffee | 0.83 | 0.74 | -10 |
| Cheyenne | 8.26 | 9.44 | 14 |
| Clear Creek | 0.70 | 0.73 | 4 |
| Conejos | 1.05 | 1.18 | 12 |
| Costilla | 4.01 | 4.07 | 2 |
| Crowley | 1.08 | 1.11 | 3 |
| Custer | 6.06 | 5.33 | -12 |
| Delta | 0.27 | 0.32 | 20 |
| Denver | 0.14 | 0.12 | -17 |
| Dolores | 1.55 | 1.47 | -5 |
| Douglas | 0.44 | 0.37 | -16 |
| Eagle | 0.61 | 0.56 | -8 |
| Elbert | 1.00 | 0.88 | -12 |
| El Paso | 0.37 | 0.31 | -16 |
| Fremont | 0.48 | 0.60 | 24 |
| Garfield | 0.69 | 0.68 | -2 |
| Gilpin | 0.69 | 0.60 | -13 |
| Grand | 2.20 | 2.10 | -4 |
| Gunnison | 1.06 | 0.93 | -12 |
| Hinsdale | 1.88 | 2.02 | 8 |
| Huerfano | 1.57 | 1.86 | 18 |
| Jackson | 4.57 | 4.95 | 8 |
| Jefferson | 0.29 | 0.29 | -3 |
| Kiowa | 10.14 | 11.28 | 11 |
| Kit Carson | 2.12 | 2.49 | 18 |
| Lake | 0.55 | 0.58 | 6 |
| La Plata | 0.71 | 0.69 | -2 |
| Larimer | 0.31 | 0.29 | -8 |
| Las Animas | 2.09 | 2.48 | 18 |
| Lincoln | 2.93 | 3.08 | 5 |
| Logan | 0.82 | 0.78 | -5 |
| Mesa | 0.27 | 0.24 | -10 |
| Mineral | 2.46 | 3.45 | 40 |
| Moffat | 0.87 | 0.98 | 12 |
| Montezuma | 0.64 | 0.72 | 13 |
| Montrose | 0.40 | 0.39 | -2 |
| Morgan | 0.70 | 0.68 | -3 |
| Otero | 0.86 | 0.94 | 9 |
| Ouray | 1.52 | 1.45 | -5 |
| Park | 1.62 | 1.94 | 19 |
| Phillips | 1.73 | 1.87 | 8 |
| Pitkin | 1.34 | 1.17 | -13 |
| Prowers | 1.47 | 1.68 | 14 |
| Pueblo | 0.28 | 0.25 | -9 |
| Rio Blanco | 1.06 | 1.13 | 7 |
| Rio Grande | 0.85 | 0.95 | 11 |
| Routt | 0.75 | 0.65 | -14 |
| Saguache | 1.19 | 1.22 | 2 |
| San Juan | 3.37 | 2.81 | -17 |
| San Miguel | 1.53 | 1.43 | -7 |
| Sedgwick | 2.75 | 3.38 | 23 |
| Summit | 0.75 | 0.68 | -10 |
| Teller | 0.76 | 0.79 | 4 |
| Washington | 4.65 | 4.80 | 3 |
| Weld | 0.32 | 0.24 | -23 |
| Yuma | 2.25 | 2.32 | 3 |
| All Colorado Counties | 0.39 | 0.35 | -11 |
(the data for the 2020 census has not been released)
In 2000 and 2010, the average resident of Urbanized Areas in Colorado consumed approximately one-fifth of an acre of urban land. In 2000, average per capita land consumption was 0.2 acre; by 2010, it had increased to 0.21 acre, an increase of four percent. That is, urban population density decreased slightly.
| Urbanized Area | Per Capita Land Consumption – 2000 (acre) | Per Capita Land Consumption – 2010 (acre) | % Change in Per Capita Land Consumption, 2000-2010 |
|---|---|---|---|
| Denver--Aurora, CO | 0.16 | 0.18 | 12 |
| Colorado Springs, CO | 0.27 | 0.21 | -21 |
| Fort Collins, CO | 0.26 | 0.27 | 2 |
| Pueblo, CO | 0.28 | 0.35 | 25 |
| Grand Junction, CO | 0.39 | 0.39 | 1 |
| Greeley, CO | 0.23 | 0.22 | -3 |
| Boulder, CO | 0.19 | 0.18 | -3 |
| Longmont, CO | 0.20 | 0.18 | -7 |
| Lafayette--Louisville--Erie, CO | 0.33 | 0.32 | -4 |
| All Colorado Urbanized Areas | 0.20 | 0.21 | 4 |
On average, across these 35 years, all Colorado counties increased in population by 83 percent, while their per capita land consumption actually decreased by 10 percent. While one of the two factors that drive urban sprawl grew in prominence, the other contracted, at least in aggregate for the state as a whole (when all counties are aggregated or added together). It should be noted, however, that per capita developed land consumption did actually increase in 37 of the 64 Colorado counties, more than half of them. Population increased in 49 out of 66 counties.
| County | % POPULATION GROWTH, 1982-2017 | % GROWTH IN PER CAPITA LAND CONSUMPTION, 1982-2017 | |
|---|---|---|---|
| Adams | 95 | 12 | |
| Alamosa | 30 | 58 | |
| Arapahoe | 95 | -9 | |
| Archuleta | 209 | 1 | |
| Baca | -32 | 50 | |
| Bent | 0 | 10 | |
| Boulder* | 95 | -19 | |
| Chaffee | 47 | -11 | |
| Cheyenne | -19 | 32 | |
| Clear Creek | 25 | 75 | |
| Conejos | 6 | 12 | |
| Costilla | 20 | 7 | |
| Crowley | 94 | -45 | |
| Custer | 198 | -30 | |
| Delta | 30 | 96 | |
| Denver | 40 | -8 | |
| Dolores | 23 | 2 | |
| Douglas | 1026 | -72 | |
| Eagle | 247 | -32 | |
| Elbert | 247 | -64 | |
| El Paso | 111 | -2 | |
| Fremont | 59 | 23 | |
| Garfield | 107 | -3 | |
| Gilpin | 126 | -11 | |
| Grand | 90 | -25 | |
| Gunnison | 55 | -22 | |
| Hinsdale | 80 | 27 | |
| Huerfano | -1 | 33 | |
| Jackson | -24 | 41 | |
| Jefferson | 46 | 9 | |
| Kiowa | -28 | 44 | |
| Kit Carson | -6 | 13 | |
| Lake | -8 | 76 | |
| La Plata | 89 | 42 | |
| Larimer | 119 | -19 | |
| Las Animas | -6 | 21 | |
| Lincoln | 22 | -9 | |
| Logan | 12 | -8 | |
| Mesa | 61 | 7 | |
| Mineral | -11 | 166 | |
| Moffat | -8 | 31 | |
| Montezuma | 45 | 51 | |
| Montrose | 64 | 42 | |
| Morgan | 25 | 2 | |
| Otero | -18 | 41 | |
| Ouray | 128 | -17 | |
| Park | 196 | -28 | |
| Phillips | -7 | 15 | |
| Pitkin | 69 | -5 | |
| Prowers | -10 | 14 | |
| Pueblo | 33 | 149 | |
| Rio Blanco | -10 | 45 | |
| Rio Grande | 4 | 16 | |
| Routt | 80 | -35 | |
| Saguache | 61 | -15 | |
| San Juan | -24 | 104 | |
| San Miguel | 166 | -39 | |
| Sedgwick | -28 | 88 | |
| Summit | 200 | -47 | |
| Teller | 172 | -11 | |
| Washington | -8 | 11 | |
| Weld | 143 | -49 | |
| Yuma | 2 | 6 | |
| All Colorado Counties | 83% | -10 | |
Across the more recent 2002-to-2017 period, on average, all Colorado counties increased in population by 25 percent, while their per capita land consumption actually decreased by 11 percent.
In other words, consistent with the same pattern as for the longer 1982 to 2017 time period, one of the two factors (population growth) that drive urban sprawl grew in prominence while the other (per capita land consumption) contracted, at least when aggregated at the statewide level. It should be noted, however, that per capita developed land consumption did actually increase in 32 of the 64 Colorado counties, exactly half of them. However, the counties with declines in per capita land consumption had the larger populations, which resulted in the statewide average reflecting the 11 percent per capita decline.
| County | % POPULATION GROWTH, 2002-2017 | % GROWTH IN PER CAPITA LAND CONSUMPTION, 2002-2017 | |
|---|---|---|---|
| Adams | 36 | -5 | |
| Alamosa | 7 | 31 | |
| Arapahoe | 27 | -15 | |
| Archuleta | 22 | -8 | |
| Baca | -18 | 22 | |
| Bent | -2 | 7 | |
| Boulder* | 22 | -11 | |
| Chaffee | 17 | -10 | |
| Cheyenne | -13 | 14 | |
| Clear Creek | 1 | 4 | |
| Conejos | -3 | 12 | |
| Costilla | 3 | 2 | |
| Crowley | 3 | 3 | |
| Custer | 31 | -12 | |
| Delta | 6 | 20 | |
| Denver | 27 | -17 | |
| Dolores | 9 | -5 | |
| Douglas | 61 | -16 | |
| Eagle | 24 | -8 | |
| Elbert | 19 | -12 | |
| El Paso | 29 | -16 | |
| Fremont | 1 | 24 | |
| Garfield | 26 | -2 | |
| Gilpin | 26 | -13 | |
| Grand | 17 | -4 | |
| Gunnison | 18 | -12 | |
| Hinsdale | -1 | 8 | |
| Huerfano | -12 | 18 | |
| Jackson | -10 | 8 | |
| Jefferson | 9 | -3 | |
| Kiowa | -10 | 11 | |
| Kit Carson | -13 | 18 | |
| Lake | 1 | 6 | |
| La Plata | 21 | -2 | |
| Larimer | 30 | -8 | |
| Las Animas | -8 | 18 | |
| Lincoln | -7 | 5 | |
| Logan | 4 | -5 | |
| Mesa | 23 | -10 | |
| Mineral | -7 | 40 | |
| Moffat | -1 | 12 | |
| Montezuma | 9 | 13 | |
| Montrose | 19 | -2 | |
| Morgan | 3 | -3 | |
| Otero | -7 | 9 | |
| Ouray | 24 | -5 | |
| Park | 14 | 19 | |
| Phillips | -5 | 8 | |
| Pitkin | 19 | -13 | |
| Prowers | -15 | 14 | |
| Pueblo | 13 | -9 | |
| Rio Blanco | 7 | 7 | |
| Rio Grande | -8 | 11 | |
| Routt | 23 | -14 | |
| Saguache | 7 | 2 | |
| San Juan | 20 | -17 | |
| San Miguel | 13 | -7 | |
| Sedgwick | -14 | 23 | |
| Summit | 23 | -10 | |
| Teller | 15 | 4 | |
| Washington | -2 | 3 | |
| Weld | 51 | -23 | |
| Yuma | 2 | 3 | |
| All Colorado Counties | 25 | -11 | |
Population in Colorado’s nine Urbanized Areas (UA’s) grew on average by 20 percent during from 2000 to 2010, compared to four percent growth in per capita urbanized land consumption (2020 data is not yet available). More than half the UA’s (5 of 9) experienced declines in per capita urbanized land consumption, that is, their population densities rose.
| County | % POPULATION GROWTH, 2000-2010 | % GROWTH IN PER CAPITA LAND CONSUMPTION, 2000-2010 | |
|---|---|---|---|
| Denver--Aurora, CO | 20% | 12% | |
| Colorado Springs, CO | 20% | -21% | |
| Fort Collins, CO | 28% | 2% | |
| Pueblo, CO | 11% | 25% | |
| Grand Junction, CO | 39% | 1% | |
| Greeley, CO | 26% | -3% | |
| Boulder, CO | 2% | -3% | |
| Longmont, CO | 25% | -7% | |
| Lafayette--Louisville--Erie, CO | 31% | -4% | |
| All Colorado Urbanized Areas | 20% | 4% | |