
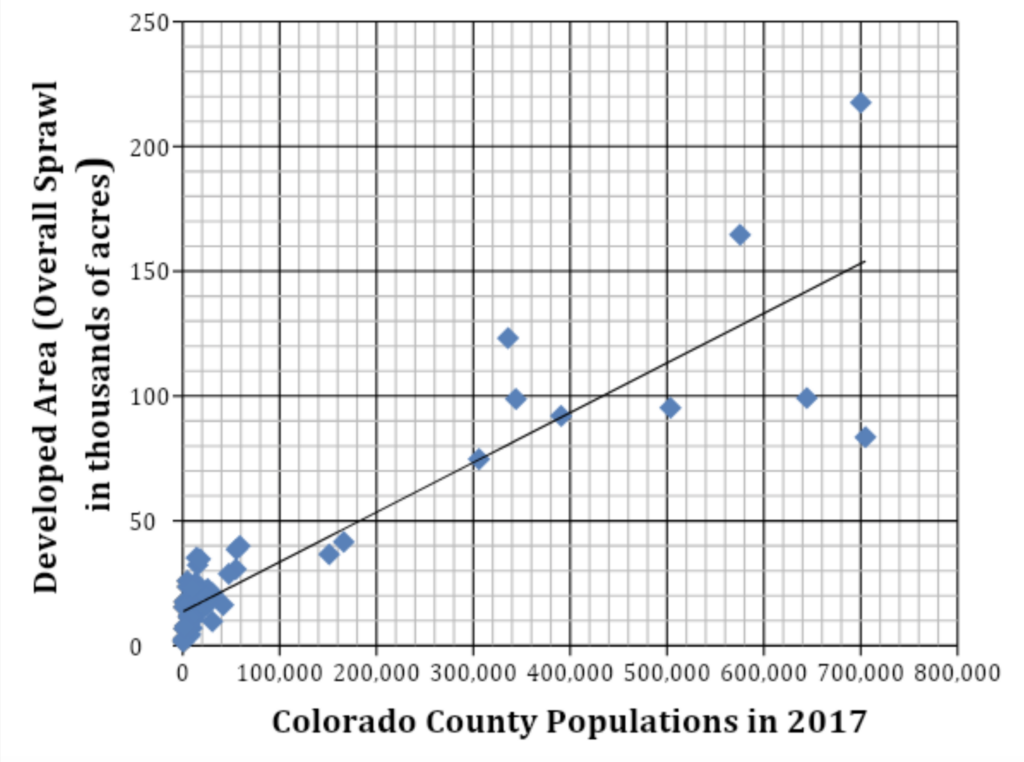
This is shown clearly in Figure 1, a simple scatter plot of the 49 states’ (excluding Alaska) cumulative populations and developed land areas in 2017. The positive (upward tilting toward the right) slope of the best-fit line means that as a state’s population increases, the area of built-up, developed land (i.e., sprawl) increases as well. This demolishes the whimsical notion entertained by those prone to wishful thinking and fairy tales that there is an insignificant connection between population size or growth rates and environmental consequences.
Although the pace of sprawl in Colorado may have peaked in the late 1990s and early 2000s, our most recent data for the past 15 years or so show that it continues to devour open space at a rate of almost 14,000 acres per year (21 square miles), or one square mile every two and a half weeks. This comes out to an average of almost 40 acres per day. And in all likelihood, this rate has accelerated with the gradual waning of the Great Recession, though we don’t yet have the data to confirm this hypothesis. Even at this reduced rate, sprawl would continue to convert an additional 140,000 acres (210 square miles) of Colorado’s valuable rural lands, Open Space, agricultural land and wildlife habitat into pavement and buildings every decade. This represents a great and permanent loss to the Centennial State’s agricultural lands, wildlife habitat, natural heritage, quality of life, and environmental sustainability.
Smart growth efforts, higher gasoline prices, fiscal and budgetary constraints (limiting new road-building, for example), the increasing popularity of (and increased political pressure for) denser city living and its cultural amenities, and the recession-inducing mortgage meltdown in 2008 may have all played roles in slowing Colorado’s rate of sprawl late in the second decade of this century. The extent to which any of these and still other unforeseen factors and events – such as the coronavirus (COVID-19) pandemic of 2020 – may affect the rate of sprawl in the coming decades is unknown and unpredictable. It may well be that, in spite of the emerging “YIMBY” (“Yes In My Backyard”) movement, that concerns about high density residential living in the face of disease pandemics could increase sprawl pressures by raising the preference of consumers for lower-density suburban neighborhoods.
As an April 2020 article in The New York Times indicated:
The article quoted Brookings Institution demographer William Frey, who noted that even before the coronavirus pandemic, “millennials and older members of Generation Z were already increasingly choosing smaller metro areas like Tucson, Ariz.; Raleigh, N.C.; and Columbus, Ohio…. Also growing were exurbs and newer suburbs outside large cities. ‘There was a dispersion from larger metros to smaller metros, from urban cores to suburbs and exurbs.’”
A January 2021 article at ZeroHedge cited a report by the company U-Haul documenting internal U.S. migration patterns based on one-way rentals of U-Haul trucks. The article concluded that: “We have never seen such a sudden mass exodus away from major cities in modern American history.”
In any case, as more and more of Rural Colorado and Rural America succumbs to development – chipped away and clogged with roads, vehicles, people, facilities and infrastructure – at some point it will not be possible to maintain rapid rates of sprawl simply because other critical land uses – e.g., high-value crop and pastureland; national and state parks, forests, and wildlife refuges; mines; watersheds and reservoir buffer zones; utility corridors; U.S. military bases and arsenals – will represent a larger and larger fraction of the remaining undeveloped land. Water scarcity and climate change (still hotter, drier temperatures) may also restrict dispersed, never-ending development in Colorado and force higher and higher densities, like them or not.
Since 1970, population growth has conservatively accounted for approximately 70 to 90 percent of the sprawl in Colorado, depending on the city, county, and time period in question. There are exceptions to this rule of course, but they are just that, exceptions. During an earlier period (1970 to 1990), when in the nation as a whole, population growth accounted for roughly half of all sprawl, in Colorado, it was already responsible for a much higher percentage than this. For example, from 1970-1990, in Denver, population accounted for 83 percent of the sprawl that enveloped 166 square miles on the city’s expanding periphery.
In the meantime, the role of increasing per capita land consumption (what we have referred to as “land use choices”) has fallen in the country as a whole, but it has always been a minor factor in Colorado’s sprawl.
In our 2014 national-level study on sprawl, Vanishing Open Spaces: Population Growth and Sprawl in America, among other analyses, we examined urban sprawl in the largest 100 U.S. Census Bureau-delineated Urbanized Areas (UAs) in the United States in two separate time periods: from 1970 to 1990, and from 2000 to 2010. From 1970 to 1990, population growth was related to 51 percent of aggregate sprawl over that 20-year time period in the 100 largest UAs. In contrast, by the more recent 2000 to 2010 time period, the role of the population factor had increased to 70 percent.
NUSA’s most recent (2022) study – From Sea to Shining Sprawling Sea – further corroborates our hypothesis that the role of population growth in forcing continuing urban sprawl has increased over the past 50 years. Looking at the different time periods of the NRI and the NRI’s entirely different methodology of measuring Developed Land over time from the Census Bureau’s methodology for measuring changes in Urbanized Area, over time, we still derive similar results, which gives us confidence in the robustness of our findings.
If the entire 35-year period (1982-2017) of NRI data is examined in its entirety, population growth accounts for 60 percent (41,140 square miles) of the 68,560 square miles of sprawl. However, if the period is divided into two parts, 1982 to 2002, and 2002 to 2017, here is what we find:
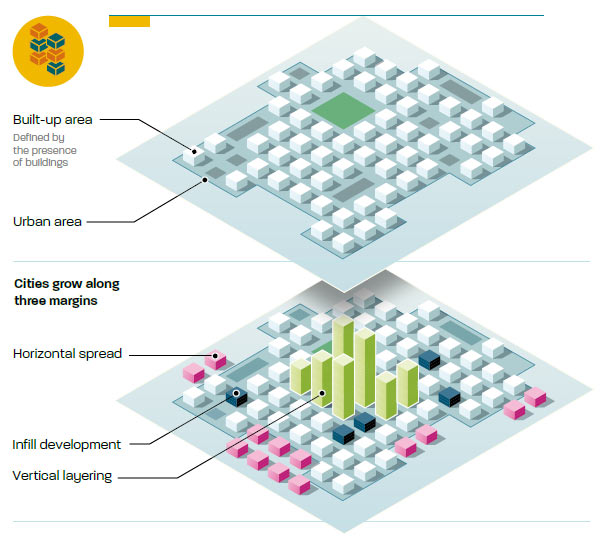
According to the World Bank, cities grow along three margins or axes to accommodate their increasing populations: horizontal spread, infill development, and vertical layering (Figure 2). Horizontal spread, or urban sprawl, is when growth of the urbanized (built-up) area extends beyond the margin of a city’s existing built-up area and pushes out into the countryside. Infill development is the closing or elimination of gaps between existing structures in the existing built-up area. Vertical layering is “raising the skyline of the existing built-up area.” These choices are sometimes summarized as “building out” (the first) or “building up” (the second and third). Under the first option, overall population density of the urbanized or developed area may stay the same or decrease. Under the second two options, population density increases.
Although the pace of sprawl in Colorado may have peaked in the late 1990s and early 2000s, our most recent data for the past 15 years or so show that it continues to devour open space at a rate of almost 14,000 acres per year (21 square miles), or one square mile every two and a half weeks. This comes out to an average of almost 40 acres per day. And in all likelihood, this rate has accelerated with the gradual waning of the Great Recession, though we don’t yet have the data to confirm this hypothesis. Even at this reduced rate, sprawl would continue to convert an additional 140,000 acres (210 square miles) of Colorado’s valuable rural lands, Open Space, agricultural land and wildlife habitat into pavement and buildings every decade. This represents a great and permanent loss to the Centennial State’s agricultural lands, wildlife habitat, natural heritage, quality of life, and environmental sustainability.
Smart growth efforts, higher gasoline prices, fiscal and budgetary constraints (limiting new road-building, for example), the increasing popularity of (and increased political pressure for) denser city living and its cultural amenities, and the recession-inducing mortgage meltdown in 2008 may have all played roles in slowing Colorado’s rate of sprawl late in the second decade of this century. The extent to which any of these and still other unforeseen factors and events – such as the coronavirus (COVID-19) pandemic of 2020 – may affect the rate of sprawl in the coming decades is unknown and unpredictable. It may well be that, in spite of the emerging “YIMBY” (“Yes In My Backyard”) movement, that concerns about high density residential living in the face of disease pandemics could increase sprawl pressures by raising the preference of consumers for lower-density suburban neighborhoods.
One of the more controversial aspects of President Joe Biden’s proposed infrastructure plan would explicitly promote infill development and vertical layering. The plan aims to increase population densities in suburbia by limiting “exclusionary” single-family zoning and allowing for the construction of affordable housing (Figure 3) – that is, placing apartment and condo buildings in the middle of detached single-family dwellings.

Similarly, an important objective of the Smart Growth movement is to preserve open space, farmland, natural beauty, wildlife habitat, and critical environmental areas outside urban boundaries by preventing declining population density. Thus, places where population density increases should be hailed as success stories. Between 2000 and 2010 in Colorado there were five of nine Urbanized Areas (i.e., more than half of all Colorado UAs) whose density increased – in other words, their per capita land consumption decreased. However, most of these UAs still experienced appreciable sprawl.
No Urbanized Area in the country has come close to Portland, Oregon in the lengths it has gone to curb sprawl, and perhaps no city in America better exemplifies the shortcoming and limitations of the Smart Growth approach as Portland.
Despite being lauded for its urban growth boundary (UGB), extensive light rail infrastructure, and high-density mixed-use developments, even Portland has been unable to contain its own sprawl. Between 2000 and 2010, the Portland UA decreased its per capita land consumption by five percent from 0.19 acre per person to 0.18 acre per person, one of the highest average urban population densities in the country.
However, despite its modest gain in population density (reduction in per capita land consumption) over the decade, the Portland UA still sprawled outward an additional 50.4 square miles between 2000 and 2010. The addition of 266,760 people during the decade was more than enough to wipe out the increased population density and cause the urbanized area to swell by an additional 11 percent. While the UGB and other smart growth initiatives have certainly slowed the pace of sprawl in Portland, some contend that they have driven up real estate and housing prices within the city. This has led to spill-over sprawl in other nearby cities and along the scenic Willamette Valley as people seek sanctuary from higher home prices. Supporting this contention is the nearby city of Salem, Oregon, whose urbanized area population grew by 14 percent from 2000 to 2010, and which has quickly become the second largest city in Oregon.
Of the 192 Urbanized Areas in the United States which experienced a decline in per capita land area during the 2000 to 2010 decade, Raleigh, North Carolina in the lengths it has gone to curb sprawl, and perhaps no city in America better exemplifies the shortcoming and limitations of the Smart Growth approach as Portland.
The drop in per capita land consumption can be explained by the efforts of city planners to tame sprawl by directing development toward certain centers within the Urbanized Area. These were not enough to prevent the construction of new suburban neighborhoods, the development of retail centers, and the creation of roads and highways to connect these sprawl products.
Recognition by scholars that population growth is a major (not the only) driver of urban land expansion and sprawl is sharply at odds with the way most news media and anti-sprawl activists in the United States have tended to portray the causes of sprawl. The news media and anti-sprawl activists appear to have accepted that rapid, unending U.S. population growth on the order of 20 to 30 or more million new residents per decade is a given and a fait accompli.
Thus, since they want to convince Americans that something can still be done to halt or slow sprawl substantially in spite of never-ending U.S. population growth, they tend to downplay or minimize population’s importance as a causal factor in sprawl. In their efforts to publicize sprawl to the American public and enlist support for anti-sprawl measures – e.g., “smart growth” policies, higher residential densities, multifamily housing (apartments and condominiums), mixed land uses and zoning, and infill that eliminates existing urban open space (such as golf courses) – they reserve their criticism for “low-density sprawl,” essentially giving a pass to other new development on the urban periphery, as long as it is not low-density, even though it still permanently devours rural land and open space.
If current demographic trends in Colorado continue as projected by official state demographers, the state’s population would grow by nearly 1.8 million residents (from 2020 to 2050) and still be growing rapidly.
The year 2050 – halfway through this century – is just 28 years away. Many of today’s toddlers will have started careers and families of their own. And these folks will not be able to enjoy the Open Space and elbow room that made Colorado such a beloved homeland for its residents and cherished destination for outdoor adventure-minded Americans alike.
While the findings of this study directly challenge the assumptions of many Smart Growth and New Urbanism advocates that population growth plays only a small role in Overall Sprawl, they do not discount the necessity for smarter urban planning that reduces per capita land consumption. The results of this study suggest that in Colorado less than a fifth of recent sprawl was caused by a complicated array of zoning laws, infrastructure subsidies, and complex socioeconomic forces. Efforts to make cities and communities more space-efficient and livable are certainly needed, but they largely ignore the main concern that sprawl is eating away at Colorado’s Open Space.
As noted above, based on the results of our study, urban sprawl will engulf perhaps another 630,000 acres (about 984 square miles) of Open Space, farmland, and wildlife habitat in Colorado by 2050 if current population growth trends continue.
Local policy makers truly trying to curb sprawl in Colorado cities have a number of policy actions and instruments at their disposal. While most local officials see population growth as an indicator of the vibrancy and vitality of their respective communities, there is little evidence to suggest that unfettered population growth is any of those things. Well-known sprawl critic and urban planner Eben Fodor, author of Better Not Bigger, challenged this very notion in his 2010 study “Relationship between Growth and Prosperity in 100 Largest U.S. Metropolitan Areas.”
Fodor’s study found that rapidly expanding metropolitan areas did not hold up well in terms of standard economic indicators such as unemployment rates, per capita income, and poverty rates in comparison with slower growing metropolitan areas. Yet, despite this, local officials and city planners continue to offer subsidies and tax breaks to attract new residents, investment and development. Many times these subsidies are born unfairly by existing residents, who see their property taxes rise and are stuck paying the bill for sprawling highways, new schools, water and wastewater treatment, and energy grids ever farther from the urban core.
Many cities have overly complicated or restrictive zoning laws that drive up home prices. New immigrants and low income families are being priced out and into the more affordable suburbs and Sunbelt cities. Sprawl in the Sunbelt is of particular concern because its growth puts added strain on already scarce water resources. In order for cities to properly address sprawl, taxpayer subsidies need to be removed and the true costs of development need to be borne by those developing the land. Also, as suggested by Harvard economist Edward Glaeser, author of Triumph of the City, the true social costs of activities such as driving should be paid for. More sensible planning policies and zoning ordinances can help curb sprawl and reduce the size of population booms in areas not suited to handle large populations.
The U.S. Environmental Protection Agency (EPA) has a website devoted to Smart Growth at: https://www.epa.gov/smartgrowth. It contains a number of practical resources for planners, activists, developers, and local officials to help promote smart growth, which EPA defines as: “a range of development and conservation strategies that help protect our health and natural environment and make our communities more attractive, economically stronger, and more socially diverse.”
The EPA Smart Growth website lists the 10 principles of smart growth developed in 1996 by the Smart Growth Network, an alliance of environmental, affordable housing, real estate and development, historic preservation, public health, government, and other groups. The ten principles of Smart Growth are:
In recent years, a growing pro-development citizens’ movement in urban centers has emerged and been making waves. This so-called YIMBY movement (for “Yes In My Backyard”, in explicit contrast to the NIMBY or “Not In My Backyard” movement) began in San Francisco in the early 2010s, fueled by millennials fed up with astronomical housing prices that effectively priced them out of living in the city. According to The Guardian, YIMBY advocates see themselves as progressive housing activists welcoming higher density and rents and mortgages affordable to the middle class, while their detractors denounce them as dupes for luxury developers, contributing to the gentrification of urban centers. In San Francisco, NIMBYs have clashed with Hispanic organizations over housing developments proposed for the low-income, traditionally Hispanic Mission District.
In the authors’ view, in general, Smart Growth principles and strategies should be pursued for the sake of environmental sustainability and neighborhood livability in any case, regardless of the amount of population growth that is occurring. From the findings of this study however, as well as recent experience around the country, it is quite evident that Smart Growth alone will not stop urban sprawl from devouring the countryside. Physicist and famed population activist Dr. Albert Bartlett wrote that: “smart growth will destroy the environment, but it will do it in a sensitive way.” The authors would phrase this idea somewhat differently: smart growth is necessary but not sufficient to save the environment and open spaces from incessant sprawl.
In early 2020, the coronavirus pandemic threw a curve ball into all of these long-term trends and emerging considerations, and proponents of higher urban densities have been put on the defensive. As the headline of an article in the Los Angeles Times expressed it: “Building dense cities was California’s cure for the housing crisis. Then came coronavirus.”
In our 2022 opinion survey of 1,024 likely Colorado voters, we asked what they thought of efforts to control sprawl by changing zoning and land use management to raise population densities in the state’s urban areas. Almost half (48%) supported increasing density as a way of accommodating further population growth while avoiding accompanying sprawl, a higher percentage than those who “somewhat” or “strongly” opposed efforts to increase residential population density (42%).
Beyond the short term, local government officials across the country supportive of growth control and management can hope only to slow population growth in their jurisdictions if the national population continues to increase by some 2.0 to 2.5 million additional residents each year. These 20-25 million additional Americans each decade will nearly all settle in some community, inevitably leading to additional sprawl as far and as long as the eye can see. Each one of these added millions will seek a home in some community or another, thereby adding to that community’s physical footprint on an ever more cluttered landscape.
In essence there are only three sources of national population growth: native fertility (in conjunction with slowly increasing life spans), immigration, and immigrant fertility. We know the following about their contribution to long-term growth:
Thus, long-term population growth in the United States and Colorado is in the hands of federal policy makers. It is they who have increased the annual intake and settlement of immigrants from one-quarter million in the 1950s and1960s to over a million since 1990, fluctuating between one million and nearly two million, once net illegal immigration is included. Until the numerical level of national immigration is lowered, even the best local plans and political commitment will be unable to stop sprawl. Yet the Biden administration has been moving in the opposite direction, opening the southern border to any from around the world who wish to enter and signaling that it wants to pass one or more amnesties as well as increase legal immigration rates.
Any serious efforts to halt the loss of open space, farmland, and wildlife habitat in the United States must include reducing the volume of population growth, which requires lowering the level of immigrants entering the country each year unless Americans and immigrants decide to move to a one-child per woman average.
A far more sustainable immigration level would be the approximately half-million a year recommended in 1995 by the bi-partisan U.S. Commission on Immigration Reform, established by President Clinton and chaired by former Democratic Congresswoman Barbara Jordan. That would move annual immigration back to around the level that was the norm as recently as the 1980s.
A poll of 1,500 America’s likely voters in May 2020 by Pulse Opinion Research found that reducing immigration had the support of about half the U.S. population when linked with the goal of slowing down U.S. population growth (see Appendix G for the full survey questions and results). Approximately an equal number of respondees favored maintaining or increasing immigration level and associated population growth. Thus, Americans are more or less evenly divided over immigration levels and population growth.
In the more recent 2022 poll of 1,024 likely Colorado voters, a slim majority (53%) thought that the federal government should reduce annual immigration levels to slow down Colorado’s population growth, and more than twice as many thought that current legal immigration levels should be lowered (43%) than raised (17%) from current levels of about a million per year.
The lower level of immigration at around half a million (500,000) per year would drive far less sprawl than the present levels exceeding a million a year. But unless Americans decide to lower their birth rates to far below replacement level, the 500,000 a year would still drive considerable population growth, sprawl, and environmental degradation indefinitely.
That is why another federal commission recommended far greater reductions in immigration. In 1996, the President’s Council on Sustainable Development recommended that the United States stabilize its population in order to meet various environmental and quality-of-life goals, and it called for reducing immigration to a level that would allow for a stable population. At current just below-replacement native fertility rates, that would require a return down to at least the quarter-million level of immigration in the 1950s and 1960s.
The Population and Consumption Task Force of President Clinton’s Council on Sustainable Development concluded in 1996: “This is a sensitive issue, but reducing immigration levels is a necessary part of population stabilization and the drive toward sustainability.”
It is important to underscore that the additional sprawl that occurs because of high immigration levels has nothing to do with the caliber of immigrants as people or individuals but everything to do with the quantity of population growth that occurs because of immigration. This can be seen by simply observing that cities with high population growth have high amounts of sprawl, regardless of whether most of the incoming new residents come from another region of the United States or from another continent.
In our 2003 national-level study, we devoted several pages to our findings on ways in which an Urbanized Area’s population growth from immigrants would have either a larger or smaller effect on sprawl than a net population growth of the same size from U.S.-born residents. We could find no precise method of quantification but concluded that the various factors largely balanced each other.
A key way in which growth from immigration has a somewhat smaller effect on sprawl is the lower average income level and, thus, a lower consumption level of the average immigrant. But we found that an assumption about immigrants having less of an effect because they presumably prefer central cities to suburbs was false. The majority of immigrants now live in suburbs where the sprawl occurs. And the adult children of immigrants were found to be just as likely to shun living in core cities as the adult children of natives. In fact, the lower incomes were causing immigrants to move to the edges of cities and even to rural settlements beyond the cities to find cheaper housing.
In parts of the country, regions are undergoing rapid population growth from internal migration of U.S. residents and citizens fleeing from cities and states heavily affected by immigration. This then, is a secondary or indirect effect of mass immigration. This is especially true in the West and the long-running exodus of native-born working-class and middle-class Californians out of that state and into the neighboring states of Nevada, Arizona, Oregon, Washington, Idaho, Colorado, and beyond.
More of Colorado’s population growth is due to net migration than natural increase. California is the largest single sending state to Colorado (Table 1). Among the top migrant-sending states to Colorado, only Missouri (10th place) is not a heavy immigrant-receiving state. Because California has experienced so many negative quality-of-life and economic consequences from its massive, immigration-fueled population growth, in recent decades Colorado has received a large number of California “refugees” fleeing the effects of this overpopulation. Because virtually all of California’s population growth is due to immigration, much of the California migration into Colorado (and other states) must be considered yet another consequence of the quadrupled level of annual immigration rates since 1970.
| Rank | State |
|---|---|
| 1. | California |
| 2. | Texas |
| 3. | Florida |
| 4. | Arizona |
| 5. | Illinois |
| 6. | New York |
| 7. | Virginia |
| 8. | North Carolina |
| 9. | Georgia |
| 10. | Missouri |
On a local level, the sprawl pressures of population growth are similar regardless of where the new residents originate. But very few Urbanized Areas are likely to be able to subdue population growth and sprawl if the federal government continues policies that add around 20 million or more people to the nation each decade, all of whom have to settle in some locality. The reality – which can only be mitigated but not eliminated by good planning or Smart Growth – is that these localities all occupy lands that were formerly productive irrigated agricultural lands or irreplaceable natural habitats.
This is not a sustainable path, and it is not one we believe that fully informed Americans would voluntarily choose.